Don't start with the SKU table. Read it the way it is ordered: diagnosis first, plans early, detail on demand.
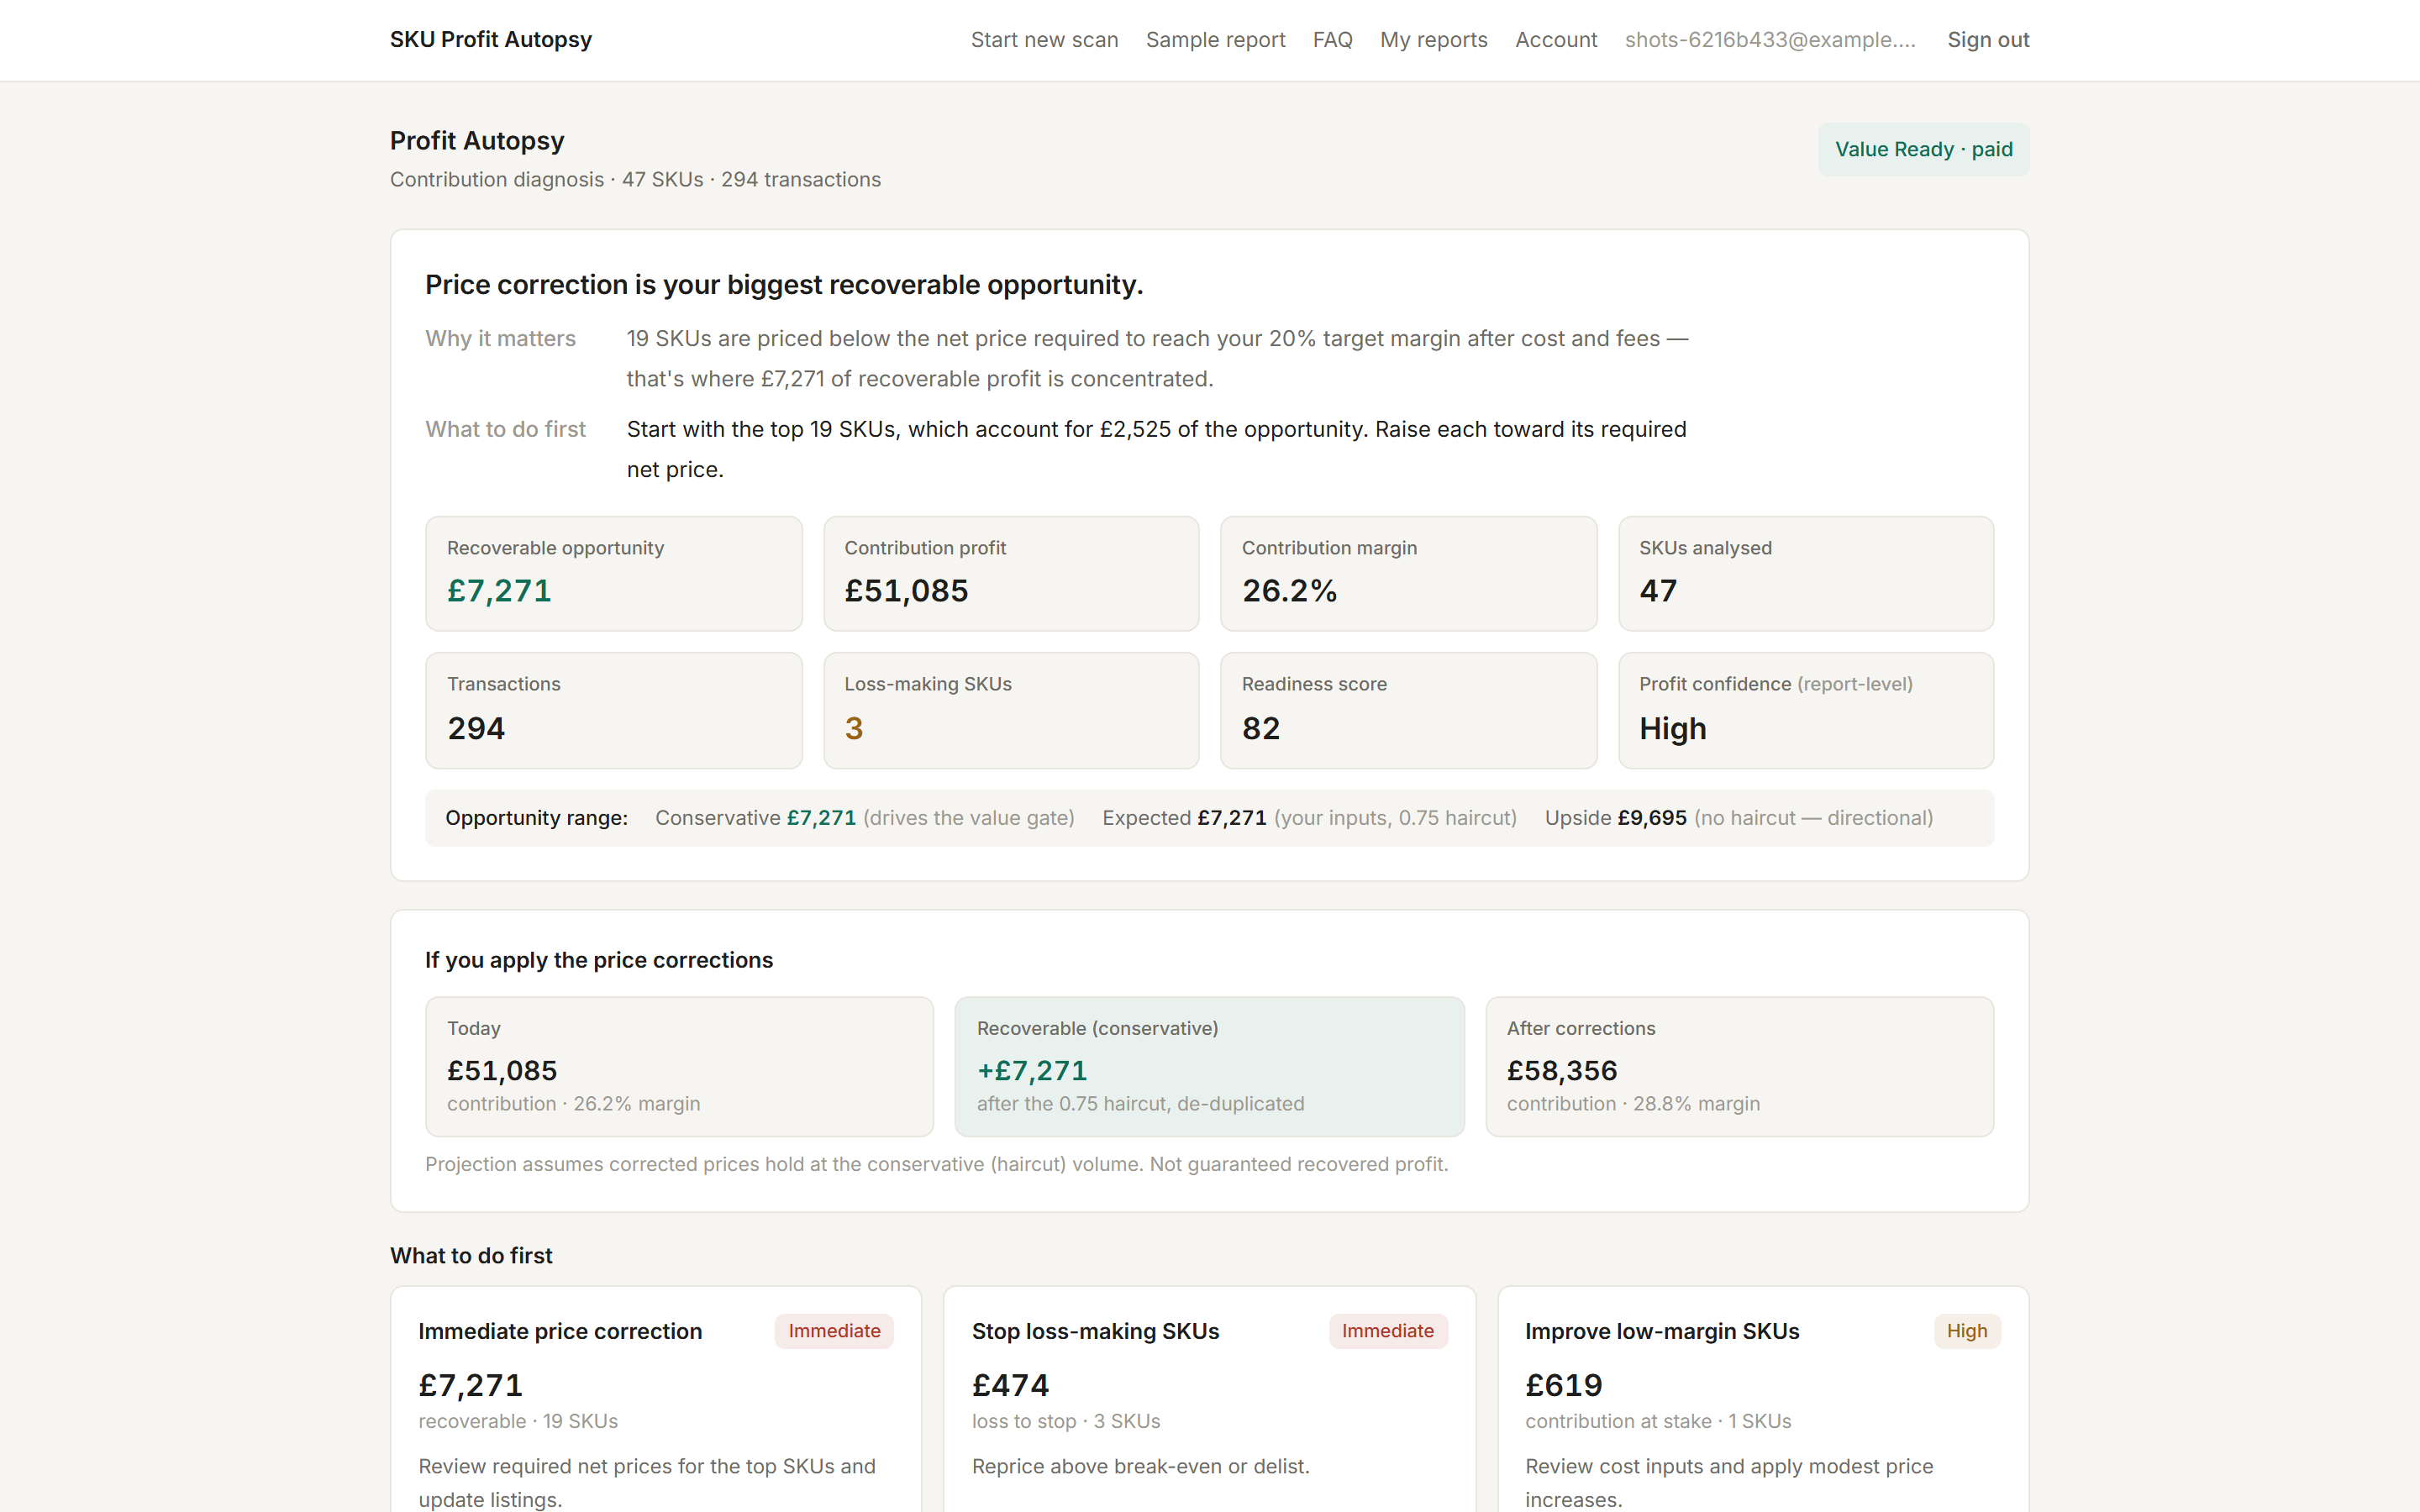
1. Diagnosis and KPIs
One plain-language paragraph naming your biggest problem, over a strip of the fundamentals: net sales, contribution profit, margin, SKU count.
2. Recoverable opportunity
Three tiers — conservative (the defensible number; execute against this), expected, and upside. Cash-at-risk from stock is shown separately because it is one-time cash, not recurring profit, and it is never added to the headline.
3. Waterfall
Gross sales → discounts → refunds → fees → shipping → cost of goods → contribution. This is where "we sold £80k, where did it go?" gets answered.
4. Profit leaks by segment
The heart of the report: underpriced SKUs (with the exact required price), loss-makers, low margin, missing costs, fee/shipping/refund leakage, stockouts and slow movers. Every segment says why it matters, what to do, and which SKUs drive it. Expand any SKU for its full economics — including break-even net price and required net and list price at your target margin.
5. Plans and assumptions
The 7-day plan is your Monday morning list, ordered by impact; the 30-day plan is the structural work. Then read the assumptions card once: target margin, horizon, cost sources, any sign normalisations — every parameter is labelled with where it came from.
Prefer working in a spreadsheet? Everything here exports — see exports and downloads. And you can see this whole layout right now on the annotated sample report.